<?xml version="1.0" encoding="utf-8"?><feed xmlns="http://www.w3.org/2005/Atom" xml:lang="en"><generator uri="https://jekyllrb.com/" version="4.3.3">Jekyll</generator><link href="https://marcosmolla.github.io/feed.xml" rel="self" type="application/atom+xml"/><link href="https://marcosmolla.github.io/" rel="alternate" type="text/html" hreflang="en"/><updated>2024-08-01T10:58:17+00:00</updated><id>https://marcosmolla.github.io/feed.xml</id><title type="html">blank</title><subtitle>A simple, whitespace theme for academics. Based on [*folio](https://github.com/bogoli/-folio) design. </subtitle><entry><title type="html">Julia’s Argument Passing Behaviour</title><link href="https://marcosmolla.github.io/blog/2023/julia-pass-by-sharing/" rel="alternate" type="text/html" title="Julia’s Argument Passing Behaviour"/><published>2023-10-05T13:00:00+00:00</published><updated>2023-10-05T13:00:00+00:00</updated><id>https://marcosmolla.github.io/blog/2023/julia-pass-by-sharing</id><content type="html" xml:base="https://marcosmolla.github.io/blog/2023/julia-pass-by-sharing/"><![CDATA[<p>There is an interesting behaviour that exists in various programming languages, where a mutable (i.e. it can be changed) object (such as an <code class="language-plaintext highlighter-rouge">Array</code>) is changed in place, if it is passed as an argument to a function and then changed inside that function.</p> <p>Let’s begin with a matrix as the object we will pass to a function, say:</p> <div class="language-julia highlighter-rouge"><div class="highlight"><pre class="highlight"><code><span class="n">m</span> <span class="o">=</span> <span class="x">[</span><span class="mi">0</span> <span class="mi">1</span> <span class="mi">1</span> <span class="mi">0</span> <span class="mi">1</span><span class="x">;</span> <span class="mi">1</span> <span class="mi">0</span> <span class="mi">0</span> <span class="mi">1</span> <span class="mi">0</span><span class="x">;</span> <span class="mi">1</span> <span class="mi">0</span> <span class="mi">0</span> <span class="mi">1</span> <span class="mi">0</span><span class="x">;</span> <span class="mi">0</span> <span class="mi">1</span> <span class="mi">1</span> <span class="mi">0</span> <span class="mi">0</span><span class="x">;</span> <span class="mi">1</span> <span class="mi">0</span> <span class="mi">0</span> <span class="mi">0</span> <span class="mi">0</span><span class="x">]</span>
<span class="n">new_m</span> <span class="o">=</span> <span class="n">m</span><span class="x">[</span><span class="o">:</span><span class="x">,</span><span class="o">:</span><span class="x">]</span> <span class="c"># make a copy of the original matrix</span>
<span class="n">new_m</span>
</code></pre></div></div> <p>This will return the following matrix:</p> <div class="language-julia highlighter-rouge"><div class="highlight"><pre class="highlight"><code><span class="mi">5</span><span class="n">×5</span> <span class="kt">Matrix</span><span class="x">{</span><span class="kt">Int64</span><span class="x">}</span><span class="o">:</span>
 <span class="mi">0</span>  <span class="mi">1</span>  <span class="mi">1</span>  <span class="mi">0</span>  <span class="mi">1</span>
 <span class="mi">1</span>  <span class="mi">0</span>  <span class="mi">0</span>  <span class="mi">1</span>  <span class="mi">0</span>
 <span class="mi">1</span>  <span class="mi">0</span>  <span class="mi">0</span>  <span class="mi">1</span>  <span class="mi">0</span>
 <span class="mi">0</span>  <span class="mi">1</span>  <span class="mi">1</span>  <span class="mi">0</span>  <span class="mi">0</span>
 <span class="mi">1</span>  <span class="mi">0</span>  <span class="mi">0</span>  <span class="mi">0</span>  <span class="mi">0</span>
</code></pre></div></div> <p>Assume we pass this matrix to a function to work with it</p> <div class="language-julia highlighter-rouge"><div class="highlight"><pre class="highlight"><code><span class="k">function</span><span class="nf"> update_m</span><span class="x">(</span><span class="n">x</span><span class="x">)</span>
    <span class="n">len</span> <span class="o">=</span> <span class="n">size</span><span class="x">(</span><span class="n">x</span><span class="x">)[</span><span class="mi">1</span><span class="x">];</span>
    <span class="n">x</span> <span class="o">=</span> <span class="n">ones</span><span class="x">(</span><span class="kt">Int</span><span class="x">,</span> <span class="n">len</span><span class="x">,</span> <span class="n">len</span><span class="x">);</span>
<span class="k">end</span>

<span class="n">update_m</span><span class="x">(</span><span class="n">new_m</span><span class="x">)</span>
<span class="n">new_m</span>
</code></pre></div></div> <p><code class="language-plaintext highlighter-rouge">update_m()</code> passes the matrix on to the <code class="language-plaintext highlighter-rouge">x</code> argument. Inside the function, we create a new matrix, which we then assign to x. The function ends with nothing being returned. When we now take a look at our original matrix we see:</p> <div class="language-julia highlighter-rouge"><div class="highlight"><pre class="highlight"><code><span class="mi">5</span><span class="n">×5</span> <span class="kt">Matrix</span><span class="x">{</span><span class="kt">Int64</span><span class="x">}</span><span class="o">:</span>
 <span class="mi">0</span>  <span class="mi">1</span>  <span class="mi">1</span>  <span class="mi">0</span>  <span class="mi">1</span>
 <span class="mi">1</span>  <span class="mi">0</span>  <span class="mi">0</span>  <span class="mi">1</span>  <span class="mi">0</span>
 <span class="mi">1</span>  <span class="mi">0</span>  <span class="mi">0</span>  <span class="mi">1</span>  <span class="mi">0</span>
 <span class="mi">0</span>  <span class="mi">1</span>  <span class="mi">1</span>  <span class="mi">0</span>  <span class="mi">0</span>
 <span class="mi">1</span>  <span class="mi">0</span>  <span class="mi">0</span>  <span class="mi">0</span>  <span class="mi">0</span>
</code></pre></div></div> <p>that nothing has changed.</p> <p>But what happens when, instead of assigning a new value to <code class="language-plaintext highlighter-rouge">x</code>, we change <code class="language-plaintext highlighter-rouge">x</code> by indexing it with <code class="language-plaintext highlighter-rouge">[:]</code>?</p> <div class="language-julia highlighter-rouge"><div class="highlight"><pre class="highlight"><code><span class="k">function</span><span class="nf"> update_m_mutate</span><span class="x">(</span><span class="n">x</span><span class="x">)</span>
    <span class="n">len</span> <span class="o">=</span> <span class="n">size</span><span class="x">(</span><span class="n">x</span><span class="x">)[</span><span class="mi">1</span><span class="x">];</span>
    <span class="n">x</span><span class="x">[</span><span class="o">:</span><span class="x">]</span> <span class="o">=</span> <span class="n">ones</span><span class="x">(</span><span class="kt">Int</span><span class="x">,</span> <span class="n">len</span><span class="x">,</span> <span class="n">len</span><span class="x">);</span>
<span class="k">end</span>

<span class="n">update_m_mutate</span><span class="x">(</span><span class="n">new_m</span><span class="x">)</span>
<span class="n">new_m</span>

<span class="mi">5</span><span class="n">×5</span> <span class="kt">Matrix</span><span class="x">{</span><span class="kt">Int64</span><span class="x">}</span><span class="o">:</span>
 <span class="mi">1</span>  <span class="mi">1</span>  <span class="mi">1</span>  <span class="mi">1</span>  <span class="mi">1</span>
 <span class="mi">1</span>  <span class="mi">1</span>  <span class="mi">1</span>  <span class="mi">1</span>  <span class="mi">1</span>
 <span class="mi">1</span>  <span class="mi">1</span>  <span class="mi">1</span>  <span class="mi">1</span>  <span class="mi">1</span>
 <span class="mi">1</span>  <span class="mi">1</span>  <span class="mi">1</span>  <span class="mi">1</span>  <span class="mi">1</span>
 <span class="mi">1</span>  <span class="mi">1</span>  <span class="mi">1</span>  <span class="mi">1</span>  <span class="mi">1</span>
</code></pre></div></div> <p>Now, we find that the original <code class="language-plaintext highlighter-rouge">Array</code> to which <code class="language-plaintext highlighter-rouge">new_m</code> pointed has been changed, according to the changes made inside the function.</p> <p>The is because Julia passes arguments by sharing them. Instead of creating a copy specifically for the use inside the function, Julia simply points to the same object. This binding will only be broken, when there is a new assignment to the argument (as we have seen above with <code class="language-plaintext highlighter-rouge">x = ones(Int, len, len)</code>) but not if we make changes to the object.</p> <p>This behaviour is also well documented in Julia’s manual <a href="https://docs.julialang.org/en/v1/manual/functions/#man-argument-passing">right here</a>, and <a href="https://docs.julialang.org/en/v1/manual/faq/#I-passed-an-argument-x-to-a-function,-modified-it-inside-that-function,-but-on-the-outside,-the-variable-x-is-still-unchanged.-Why?">discussed here</a>.</p> <p>One big advantage (in case you are not changing the original argument) is that your computer does not have to create copies of objects that are only referenced, which will make code execution a lot more efficient.</p> <p>It is just important to keep this behaviour in mind.</p>]]></content><author><name></name></author><category term="coding"/><category term="julia"/><summary type="html"><![CDATA[A quick explanation of the "passing-by-sharing" behaviour]]></summary></entry><entry><title type="html">Culture-Network Coevolution</title><link href="https://marcosmolla.github.io/blog/2019/science-advances-culture-network-coevolution/" rel="alternate" type="text/html" title="Culture-Network Coevolution"/><published>2019-08-27T16:40:16+00:00</published><updated>2019-08-27T16:40:16+00:00</updated><id>https://marcosmolla.github.io/blog/2019/science-advances-culture-network-coevolution</id><content type="html" xml:base="https://marcosmolla.github.io/blog/2019/science-advances-culture-network-coevolution/"><![CDATA[<p><img src="/assets/img/featured_hu19337feddcabfbd8f6d4d46d8a8fceb6_2966410_720x0_resize_q90_lanczos.jpg" alt="featured"/></p> <p>What we can learn from others, such as skills that help us to cope with our environment, is largely determined by who we interact with. For example, larger and more dense social networks, where each individual interacts with many other individuals, are known to spread new behaviours or information faster and further than sparse networks (<a href="https://doi.org/10.1126/science.1185231">Centola, 2010</a>; <a href="https://doi.org/10.1073/pnas.1518798113">Derex &amp; Boyd, 2016</a>). However, it is largely unknown whether the nature of what we need to learn to survive affects our social behaviour and ultimately the structure of the social network.</p> <p>In this project, I develop an agent-based simulation model together with Erol Akçay to better understand the feedback between culture and network structure.</p> <p>Read <a href="https://penntoday.upenn.edu/news/societys-cultural-practices-shape-structure-its-social-networks-penn-study-shows">UPenn’s official press release</a> or the aricle in <a href="https://doi.org/10.1126/sciadv.aaw0609">Science Advances</a>.</p>]]></content><author><name></name></author><category term="sample-posts"/><category term="formatting"/><category term="links"/><summary type="html"><![CDATA[Re press-release of our 2019 Sceince Advances article]]></summary></entry><entry><title type="html">Updating Julia on your cluster</title><link href="https://marcosmolla.github.io/blog/2018/updating-julia-cluster/" rel="alternate" type="text/html" title="Updating Julia on your cluster"/><published>2018-03-04T04:59:00+00:00</published><updated>2018-03-04T04:59:00+00:00</updated><id>https://marcosmolla.github.io/blog/2018/updating-julia-cluster</id><content type="html" xml:base="https://marcosmolla.github.io/blog/2018/updating-julia-cluster/"><![CDATA[<p>When it comes to the console and using binaries, I am just not at all tech-savvy. I recently had to install an updated version of Julia on the computer cluster I am using (previously worked with an <em><a href="https://research.cs.wisc.edu/htcondor/">HTCondor</a></em> cluster, now I am at a <em><a href="https://slurm.schedmd.com">SLURM</a></em> cluster). I didn’t want to break everyone else’s programs, so I wanted to install it only for me.</p> <p>The Julilang website kind of already gives you the answer <a href="https://julialang.org/downloads/platform.html">here</a>. But it still took me a while to figure our exactly what to do. So, here we go.</p> <ol> <li> <p><a href="https://julialang.org/downloads/">Download the binaries</a> from the Julialang website (in my case those were the Generic Linux Binaries for 64-bit architecture)</p> </li> <li> <p>Upload this <code class="language-plaintext highlighter-rouge">.tar</code> file to your user folder on the cluster, e.g. <code class="language-plaintext highlighter-rouge">/home/yourusername/bin</code></p> </li> <li> <p>Untar the file using: <code class="language-plaintext highlighter-rouge">tar -xvf</code></p> </li> <li> <p>Change the folder name to something more useful (I just used the version number: <code class="language-plaintext highlighter-rouge">julia062</code>)</p> </li> <li> <p>Now, we need to let the server know that it should this version of julia whenever we call julia from the terminal. To do this, we need to change the <code class="language-plaintext highlighter-rouge">PATH</code> variable; Have a look with echo $PATH (should look similar to this: <code class="language-plaintext highlighter-rouge">/usr/local/sbin:/usr/local/bin:/usr/sbin:/usr/bin:/sbin:/bin:/usr/games</code>); What we want to do, is to add our path <code class="language-plaintext highlighter-rouge">/home/yourusername/bin</code> to it. So, create a/or use the .profile file in your home directory (to get to the home directory, simply enter <code class="language-plaintext highlighter-rouge">cd</code>); with the command <code class="language-plaintext highlighter-rouge">nano .profile</code> a text editor opens; We want to add our path to the beginning of the <code class="language-plaintext highlighter-rouge">PATH</code> variable, so like in math we want the new <code class="language-plaintext highlighter-rouge">PATH</code> to be our <code class="language-plaintext highlighter-rouge">PATH</code> + <code class="language-plaintext highlighter-rouge">oldPATH</code>. To achieve this we will write: <code class="language-plaintext highlighter-rouge">PATH="/home/yourusername/bin/julia062/bin:$PATH"</code>; the <code class="language-plaintext highlighter-rouge">$PATH</code> simply adds whatever the <code class="language-plaintext highlighter-rouge">PATH</code> currently is to the end of our path. (You might have to replace <code class="language-plaintext highlighter-rouge">/home/yourusername</code> with <code class="language-plaintext highlighter-rouge">$HOME</code>, depending on the server settings). Finally, save the file by pressing <code class="language-plaintext highlighter-rouge">Ctrl-X</code> and accepting the changes.</p> </li> <li> <p>Now, logout of the cluster and log in again.</p> </li> <li> <p>When you now call julia, the version you just installed should be the one up and running. Remember, that you now also need to install all the packages you want to use for the updated version of Julia.</p> </li> </ol> <p>Enjoy your latest version of Julia!</p> <p>Oh, and don’t forget to change the call in your source files as well. Those look usually like this <code class="language-plaintext highlighter-rouge">#!/usr/bin/env julia</code> but now needs to be <code class="language-plaintext highlighter-rouge">#!/home/yourusername/bin/julia062/bin julia</code>. Otherwise, you will only use the latest version of julia whenever you call it directly, but your jobs for the cluster would still run with the version installed globally.</p> <p>Still questions? Let me know how to improve this post.</p>]]></content><author><name></name></author><category term="sample-posts"/><summary type="html"><![CDATA[Updating your version of Julia on a shared computer cluster]]></summary></entry><entry><title type="html">Voice of Young Scientists Workshop</title><link href="https://marcosmolla.github.io/blog/2014/voice-of-young-scientists-workshop/" rel="alternate" type="text/html" title="Voice of Young Scientists Workshop"/><published>2014-03-15T16:40:16+00:00</published><updated>2014-03-15T16:40:16+00:00</updated><id>https://marcosmolla.github.io/blog/2014/voice-of-young-scientists-workshop</id><content type="html" xml:base="https://marcosmolla.github.io/blog/2014/voice-of-young-scientists-workshop/"><![CDATA[<p>On Friday March 14th the group Voice of Young Scientists (<a href="https://twitter.com/voiceofyoungsci">@voiceofyoungsci</a>, which belongs to Sense about Science <a href="https://twitter.com/senseaboutsci">@senseaboutsci</a>) held a workshop to encourage young researches to communicate their work to the public.</p> <p>The first session started with Matthew Cobb (@<a href="https://twitter.com/matthewcobb">matthewcobb</a>), Susanne Shultz (<a href="https://twitter.com/Susanne_Shultz">@Susanne_Shultz</a>) and Jeffrey Forshaw (<a href="https://twitter.com/jrf1968">@jrf1968</a>) three successful scientists that presented a very interesting insight into their relations with public media and journalists.</p> <p>It is not clear to me whether Jeffrey Forshaw, particle physicist at the University of Manchester, directed his comment ‘scientists are just ordinary people who are curious and want to understand’ towards the much younger scientists or the journalists in the room. However, he made the important point that it is necessary for every researcher to know its stuff. Only when you feel comfortable in your field you can freely talk about it. Also, never try to hide your work. The only way to counter prejudice against scientific work is to be pro-active. Don’t wait for the public to ask you what you do, just start to tell them. And let me add here: even when they don’t ask.</p> <p>This point was also supported by Matthew Cobb, evolutionary biologist at the University of Manchester. Being pro-active is especially important when you work in controversial areas, like gene modification, medical research, or even evolutionary biology. Writing about your and others work is good for at least two reasons. For one, you train how to write. And the other, your field becomes more understandable by the public and thus less suspicious of doing ‘bad things’.</p> <p><img src="/assets/img/voys_1.png" alt="tweet 1"/></p> <p>If you finished your work on a project with a great paper, let your press officer now. They are your best link to all kinds of media and they will also help you to make the points you intended. Susanne Shultz, like Cobb evolutionary biologist at the University of Manchester, recommends to write a press release. Looking towards the journalists, she mentions that it is a lot faster for them to copy-paste an article than to write one from scratch.It might also prevent misinterpretations.</p> <p>‘I assume’, says Forshaw, ‘media gets it always wrong.’ Therefore, be careful what you say and how you say it. Never try to oversimplify your work, but also don’t oversell it conclude Cobb and Forshaw. And most importantly, never let journalists push you to make a specific comment or statement. Never be afraid to embrace the three simple words that form the foundation of science: ‘I don’t know’ (or if you prefer ‘We don’t know’).</p> <p><img src="/assets/img/voys_2.png" alt="tweet 1"/></p> <p>
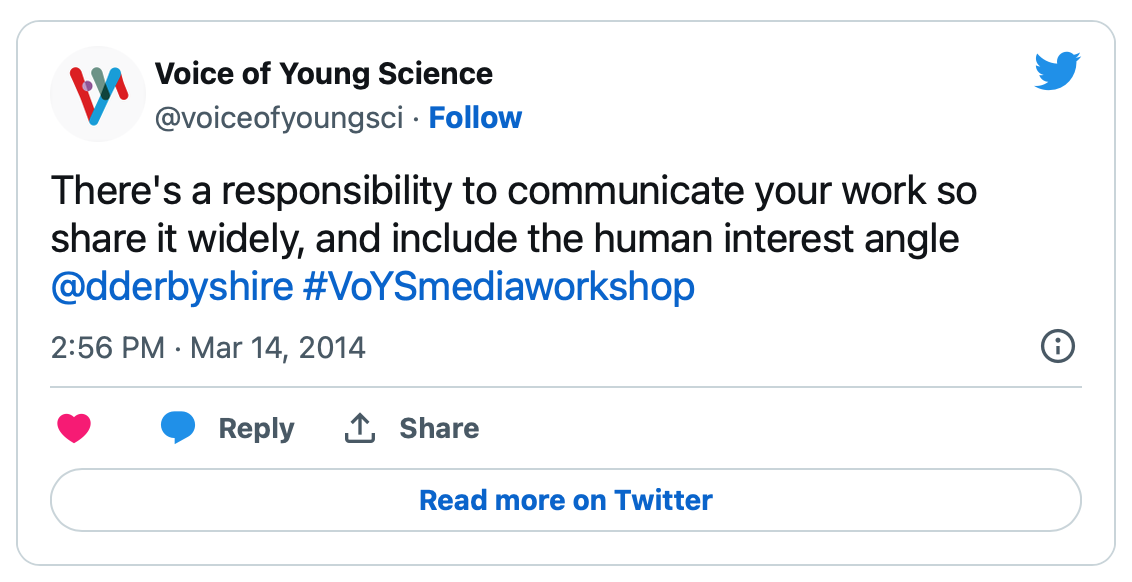
The second session brought BBC journalist Victoria Gill (<a href="https://twitter.com/Vic_Gill">@Vic_Gill</a>) and freelancing journalist David Derbyshire (<a href="https://twitter.com/dderbyshire">@dderbyshire</a>). Their description of their daily work added an interesting angle to the panel in the morning. As representatives of different media (online, telly, print) they are interested novelties and surprises. If you want a big story talk about something big, or as Derbyshire explains it, ‘Of course an elephant is more interesting than a cat, which is more interesting than a mouse, and so on.’</p> <p>Both Gill and Derbyshire point out that you shouldn’t be afraid of contacting journalists. They know what makes a good story. They are the professional story tellers and are glad to work together with whoever has something interesting to offer. Whether they talk to a PhD student, who actually does the job, or to its professor doesn’t really matter for them. Both are equally unknown to them. ‘As long as they don’t try to take over the editorial part’, states Gill.</p> <p><img src="/assets/img/voys_3.png" alt="tweet 1"/></p> <p>This was a very interesting and refreshingly different workshop. Many thanks to the organisers and all participants, especially the speakers that took their time and afford to share their experience.</p> <p>Another blogger blogged about the event here.</p>]]></content><author><name></name></author><category term="sample-posts"/><category term="formatting"/><category term="links"/><summary type="html"><![CDATA[A short recap of the event]]></summary></entry><entry><title type="html">Establishing Move on CRAN</title><link href="https://marcosmolla.github.io/blog/2012/establishing-move-on-cran/" rel="alternate" type="text/html" title="Establishing Move on CRAN"/><published>2012-12-17T16:40:16+00:00</published><updated>2012-12-17T16:40:16+00:00</updated><id>https://marcosmolla.github.io/blog/2012/establishing-move-on-cran</id><content type="html" xml:base="https://marcosmolla.github.io/blog/2012/establishing-move-on-cran/"><![CDATA[<p>On Friday, December 14th, we successfully <a href="http://cran.r-project.org/web/packages/move/index.html">published our software package ‘move’ at CRAN</a>, the popular R repository. This was a huge step for me and my group. We were working on this package, which allows us to import, analyze and visualize animal movement data, for almost a year. We already published stable versions on <a href="https://r-forge.r-project.org/R/?group_id=1349">r-forge</a> before the publication on CRAN.</p> <p>Thanks to colleagues and users from around the world we received useful feedback to make the package even better. We fixed problems and added further functionality. We now decided that it is time to make the package available to a broader audience. We published at CRAN since it is the primary repository for R packages.</p> <p>Now, it is possible to download and install the ‘move’ package from within R with:</p> <div class="language-R highlighter-rouge"><div class="highlight"><pre class="highlight"><code><span class="n">install.packages</span><span class="p">(</span><span class="s2">"move"</span><span class="p">)</span><span class="w">
</span></code></pre></div></div> <p>We aim to add further functionalities to the package soon. We hope that the package will be useful for biologists in general and movement ecologists in specific.</p>]]></content><author><name></name></author><category term="sample-posts"/><category term="formatting"/><category term="links"/><summary type="html"><![CDATA[The move software package is now on CRAN]]></summary></entry><entry><title type="html">Home Range Bootstrapping</title><link href="https://marcosmolla.github.io/blog/2012/bootstrap-home-range/" rel="alternate" type="text/html" title="Home Range Bootstrapping"/><published>2012-08-23T16:40:16+00:00</published><updated>2012-08-23T16:40:16+00:00</updated><id>https://marcosmolla.github.io/blog/2012/bootstrap-home-range</id><content type="html" xml:base="https://marcosmolla.github.io/blog/2012/bootstrap-home-range/"><![CDATA[<p>Last week we introduced a further function to the move package. It is called the <code class="language-plaintext highlighter-rouge">hrBootstrap()</code> which stands for Home Range Bootstrap. It allows to calculate the area of a minimum convex polygon (abbr. MCP) for a set of locations. A polygon is called convex if it includes all line segments connecting any pair of points (see[1]). The minimum convex polygon is the one with the shortest edge length. Given a number of locations of an animal, e.g. due to GPS recordings, the MCP algorithm returns an area that may represent the home range of that animal.</p> <p>Nowadays the MCP is scarcely if at all used to calculate home ranges. Kernel Density algorithms and Brownian Bridge Movement Models serve more sophisticated results. The results are much closer to the real observations. Nevertheless, the MCP calculation can still be used to compare own results with older studies.</p> <p>The <code class="language-plaintext highlighter-rouge">hrBootstrap()</code> function in our <code class="language-plaintext highlighter-rouge">move</code> package works for Move and MoveStack objects (individuals or groups of individuals). We implemented here the mcp() and mcp.area() function from the <code class="language-plaintext highlighter-rouge">adehabitatHR</code> package [2]. We calculate for different number of random locations the mcp. For example for a set of 70 location fixes we calculate the mcp with 5, 6, 8, 10, 13, 16, 20, 25, 32, 40, 50, and 63 locations. Each step is repeated by default 100 times, each time with different locations. The returned data frame represents the calculated mcp area (you can specify the unit with the unout argument) for the according quantiles (0%, 25%, 50%, 75%, 100%) of the values.</p> <p>By default the quantiles for the different number of locations are plotted as a line plot (see below).</p> <p>The version will be available, as soon as the r-forge page is back online again.</p> <p><img src="/assets/img/bootstrap_home_range_move.png" alt="Home range bootstrap"/></p> <p>References</p> <p>[1] Minimum Conevx Polygon (MCP) http://www.stat.ufl.edu/STA6934/Minimum%20Convex%20Polygon%201%2017%2007.pdf</p> <p>[2] Home Range Estimation in R: the adehabitatHR Package http://mirrors.fe.up.pt/CRAN/web/packages/adehabitatHR/vignettes/adehabitatHR.pdf</p>]]></content><author><name></name></author><category term="sample-posts"/><category term="formatting"/><category term="links"/><summary type="html"><![CDATA[The new home range bootstrap function for the Move package]]></summary></entry><entry><title type="html">From UD Rasters to Contour Rasters</title><link href="https://marcosmolla.github.io/blog/2012/transforming-ud-raster-into-contour-raster/" rel="alternate" type="text/html" title="From UD Rasters to Contour Rasters"/><published>2012-08-23T16:40:16+00:00</published><updated>2012-08-23T16:40:16+00:00</updated><id>https://marcosmolla.github.io/blog/2012/transforming-ud-raster-into-contour-raster</id><content type="html" xml:base="https://marcosmolla.github.io/blog/2012/transforming-ud-raster-into-contour-raster/"><![CDATA[<p>Calculating utilization distributions for animals, e.g. with Kernel Density or <a href="http://onlinelibrary.wiley.com/doi/10.1111/j.1365-2656.2012.01955.x/abstract">Dynamic Brownian Bridge Movement Model</a>, result in rasters with probabilities of presence. To calculate areas with equal levels of presence (contours) it is necessary to transform the raster, which is now done by the <code class="language-plaintext highlighter-rouge">getVolumeUD()</code> function from the <a href="https://r-forge.r-project.org/R/?group_id=1349">move package</a>.</p> <p>The function works with objects of the Raster class. This is an advantage over a similar function from the <a href="http://cran.r-project.org/web/packages/adehabitatHR/index.html"><code class="language-plaintext highlighter-rouge">adehabitatHR</code> package</a> (getvolumeUD), which works with objects of the class estUD and estUDm, that are created for example by the kernelUD function from the same package. Allowing objects from the Raster class (<a href="http://cran.r-project.org/web/packages/raster/index.html"><code class="language-plaintext highlighter-rouge">raster</code> package</a>) makes the getVolumeUD more flexible.</p> <p>Using:</p> <div class="language-R highlighter-rouge"><div class="highlight"><pre class="highlight"><code><span class="n">new</span><span class="w"> </span><span class="o">&lt;-</span><span class="w"> </span><span class="n">getVolumeUD</span><span class="p">(</span><span class="n">raster</span><span class="p">)</span><span class="w">
</span><span class="n">contour95</span><span class="w"> </span><span class="o">&lt;-</span><span class="w"> </span><span class="n">new</span><span class="o">&lt;=</span><span class="m">0</span><span class="n">.</span><span class="w">
</span></code></pre></div></div> <p>where new is the raster that is returned from <code class="language-plaintext highlighter-rouge">getVolumeUD()</code>, you calculate a new raster that has only 0 for cells that are outside the 95% contour and 1 for cells that are inside the 95% contour. It represents the 95% contour of the UD.</p> <p><img src="/assets/img/ud-to-raster.png" alt=""/> <em>
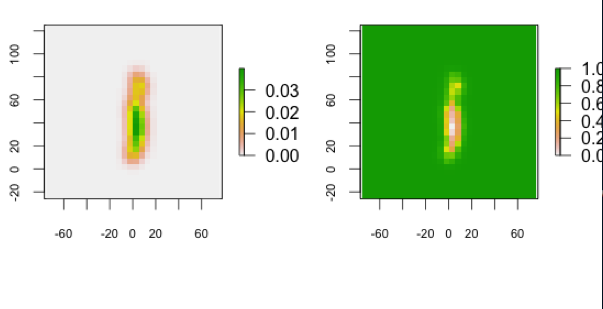
Two rasters with UD from the same record. Left: raw output from a DBBMM calculation (probabilities are between 0 and 0.03). Right: transformed raster (cells have now the values of the contour they belong to; values are between 0 and 1).</em></p> <p>[A great thank you to <a href="http://computational-ecology.com/main-lab/main-bart.html">Bart Kranstauber</a> that provided the majority of the functions code.]</p>]]></content><author><name></name></author><category term="sample-posts"/><category term="formatting"/><category term="links"/><summary type="html"><![CDATA[Transforming UD rasters into contour rasters]]></summary></entry><entry><title type="html">Update fixes WebImport for move package</title><link href="https://marcosmolla.github.io/blog/2012/updated-move-pacakge/" rel="alternate" type="text/html" title="Update fixes WebImport for move package"/><published>2012-08-12T16:40:16+00:00</published><updated>2012-08-12T16:40:16+00:00</updated><id>https://marcosmolla.github.io/blog/2012/updated-move-pacakge</id><content type="html" xml:base="https://marcosmolla.github.io/blog/2012/updated-move-pacakge/"><![CDATA[<p>With the new version of the move package (0.5.4) that we uploaded on Friday many import issues were fixed. We tested the download function with all publicly available Movebank data sets. As long as the study has no double timestamps per individual ID the studies could be imported. Now, it makes it much more fun to interact with the WebImport interface. Just import specific animals from a study to calculate their utilization distribution, UD, or other movement-related parameters.</p> <p>You find more about the move package on <a href="http://computational-ecology.com/main-move.html">our lab page</a>, or direct on <a href="http://r-forge.r-project.org/R/?group_id=1349">r-forge</a>.</p> <p>Visit as well the <a href="https://www.movebank.org/">Movebank</a> site to see which studies are public available.</p>]]></content><author><name></name></author><category term="sample-posts"/><category term="formatting"/><category term="links"/><summary type="html"><![CDATA[There is a new version out of our move R package]]></summary></entry><entry><title type="html">Using RMarkdown</title><link href="https://marcosmolla.github.io/blog/2012/using-rmarkdown/" rel="alternate" type="text/html" title="Using RMarkdown"/><published>2012-08-12T16:40:16+00:00</published><updated>2012-08-12T16:40:16+00:00</updated><id>https://marcosmolla.github.io/blog/2012/using-rmarkdown</id><content type="html" xml:base="https://marcosmolla.github.io/blog/2012/using-rmarkdown/"><![CDATA[<p>Two weeks ago I presented in the weekly R Group Meeting of the Faculty of Life Sciences (University of Manchester) how to create RMarkdown files. These are files that combine calculation and plots from R with LaTeX-esque text objects. Why would you need to bother? Because it is a stunningly fast way to share your work and results from within R with your colleagues and supervisor. Furthermore, it sets an end to the time where I created a graph or calculated a p-value and lost track which R file contained the original commands. No more searching, you will have it all in place. And here is how it works (at least for Linux and MacOS, tell me if there are problems with Windows)</p> <p>If you have the program <a href="http://www.rstudio.com/ide/download/">RStudio</a> and the R package knitr (just type in R install.packages(‘knitr’)) installed we we are ready to start.</p> <ol> <li> <p>Open RStudio and click on the new file icon</p> <p><img src="/assets/img/rmarkdown_add_file.png" alt="add_file"/></p> </li> <li> <p>Select R Markdown to create a new Markdown</p> <p><img src="/assets/img/rmarkdown_new_markdown.png" alt="new_markdown"/></p> </li> <li>RStudio will now open a template file. It already has a title some text and so called R chunks, which include R code as you would usually have in your R files.</li> <li>Add and change text and insert your R code (you can of course run the code in line or whole chunks). By the way, you find helpful information by clicking at the question mark icon in the top option bar of the source window (where you are currently entering your text). Click on Markdown Quick Reference to get an overview of useful commands. Click on Using R Markdown to get the <a href="http://www.rstudio.com/ide/docs/authoring/using_markdown?version=0.98.501&amp;mode=desktop">full introduction from the RStudio website</a>.</li> <li>If you are satisfied with the text and the data save the file in a new folder (I recommend a folder because the knitting process ends usually with a .Rmd, .md, and .html file, and maybe more files, but see below).</li> <li>Finally, click on Knit HTML to create your RMarkdown HTML file. The compiler will go through your text and your R chunks and create a Markdown file (.md) which it uses to return a HTML file.</li> </ol> <p>Okay, let’s have a look how all these file may look like in the end. Copy and paste the following code in your source window and knit it to see what the result looks like.</p> <div class="language-plaintext highlighter-rouge"><div class="highlight"><pre class="highlight"><code>The Gamma Distribution
========================================================
In _probability theory_ and statistics, the **gamma distribution** is a two-parameter family of continuous probability distributions.

The gamma distribution is described by a shape parameter $k$ and a scale parameter $\theta$. Its variance is $Var(X)=k*\theta^2$ and its mean is $E(X)=k*\theta$. The 'r 1+1'functions look like this in R:

```{r}
var_gamma &lt;- function(k,t) return(k*(t^2))
mean_gamma &lt;- function(k,t) return(k*t)

```

The next graph shows how the distribution changes with a chaging shape ($k$) value.

```{r, echo=FALSE, fig.width=10, fig.height=5}
plot(sort(rgamma(n=10000,shape=(K &lt;- c(0.1,0.5,2,5,11)),scale=0.4)), type=‘l’, col=1, lwd=2, ylim=c(0,10), xlab=‘sorted values’, ylab=‘’)
for(k in K[-1]){
lines(sort(rgamma(n=10000,shape=k,scale=0.4)), lwd=2)
}
</code></pre></div></div> <p>The resulting HTML file shout look like this:</p> <p><img src="/assets/img/rmarkdown_r_html_file.png" alt="r_html_file"/></p> <p>It is a minimal example of what you can do. We have there: a title, words in italic and bold letters, and even inline LaTeX code (it is flanked by dollar signs, find <a href="http://en.wikipedia.org/wiki/Wikipedia:LaTeX_symbols">possible LaTeX symbol code here</a>). I also included (obviously obsolete but for proof of principle) in line R code. It starts with <code class="language-plaintext highlighter-rouge">r and ends with </code>. In-between you can write whatever R code you want. You might want to calculate the sum or the mean of a data column or maybe a mean in combination with the standard deviation. You can use the following to do this:</p> <div class="language-plaintext highlighter-rouge"><div class="highlight"><pre class="highlight"><code>    ```{r}
    DF &lt;- data.frame(first=runif(10,0,1), second=runif(10,1,2))
    DF
    ```
    The mean value of the first experiment is $'r mean(DF$first)' \pm 'r sd(DF$first)'$.
</code></pre></div></div> <p>Awesome, you get your results in line without writing any number down. This means also, that this is a very useful tool if you have report that you have to write repeatedly and only the numbers change. Just update the raw data and the report changes itself the next time you knit it. (Note, I combined LaTeX and R in-line code in the above example, yes it is possible).</p> <p>You may find, that next to the introducing <code class="language-plaintext highlighter-rouge">{r}</code> there are sometimes further attributes like <code class="language-plaintext highlighter-rouge">{r setup, echo=FALSE, results='hide'}</code>. This line for example means the following:</p> <ul> <li>the chunk is called “setup”</li> <li>the code that you entered is not ‘echoed’ in the final document</li> <li>and all results are ‘hide’ in the final document</li> </ul> <p>You might use this combination when you for example just want to load some function into your file that no-one else should see. The code is still evaluated. If you have code that you don’t want to evaluate (maybe it takes a long time to calculate or you don’t care for it at the moment) just add eval=FALSE. During the knitting process this chunk will not be evaluated.</p> <p>Similarly, if you have a chunk that you only want to calculate once and want R to remember the results use cache=TRUE. This will save the results in a folder called ‘cache’. Every chunk with the argument cache=TRUE will be saved individually. As long as you don’t change the code in the chunk R will not calculate it again.</p> <p>If you think that some of the graphs that you created during knitting would fit perfectly in another document, just go to the folder that you created for this document. You will find there a folder called figure, which contains all figures that R created during knitting as png files.</p> <p>Finally, once you finished polishing your file and you want share it with your supervisor or colleague, it is enough to send the HTML file. All images are part of this HTML file due to the so called <a href="http://en.wikipedia.org/wiki/Data_URI_scheme">URI Scheme</a>.</p> <p>Now, enjoy having all your code, text and results stored in one place.</p>]]></content><author><name></name></author><category term="sample-posts"/><category term="formatting"/><category term="links"/><summary type="html"><![CDATA[Combining your R code with text elements]]></summary></entry></feed>