From UD Rasters to Contour Rasters
Calculating utilization distributions for animals, e.g. with Kernel Density or Dynamic Brownian Bridge Movement Model, result in rasters with probabilities of presence. To calculate areas with equal levels of presence (contours) it is necessary to transform the raster, which is now done by the getVolumeUD() function from the move package.
The function works with objects of the Raster class. This is an advantage over a similar function from the adehabitatHR package (getvolumeUD), which works with objects of the class estUD and estUDm, that are created for example by the kernelUD function from the same package. Allowing objects from the Raster class (raster package) makes the getVolumeUD more flexible.
Using:
new <- getVolumeUD(raster)
contour95 <- new<=0.
where new is the raster that is returned from getVolumeUD(), you calculate a new raster that has only 0 for cells that are outside the 95% contour and 1 for cells that are inside the 95% contour. It represents the 95% contour of the UD.
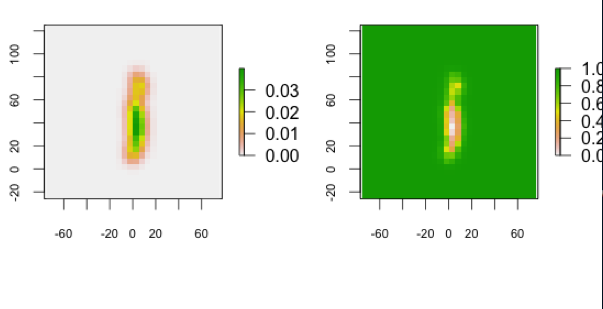 Two rasters with UD from the same record. Left: raw output from a DBBMM calculation (probabilities are between 0 and 0.03). Right: transformed raster (cells have now the values of the contour they belong to; values are between 0 and 1).
[A great thank you to Bart Kranstauber that provided the majority of the functions code.]